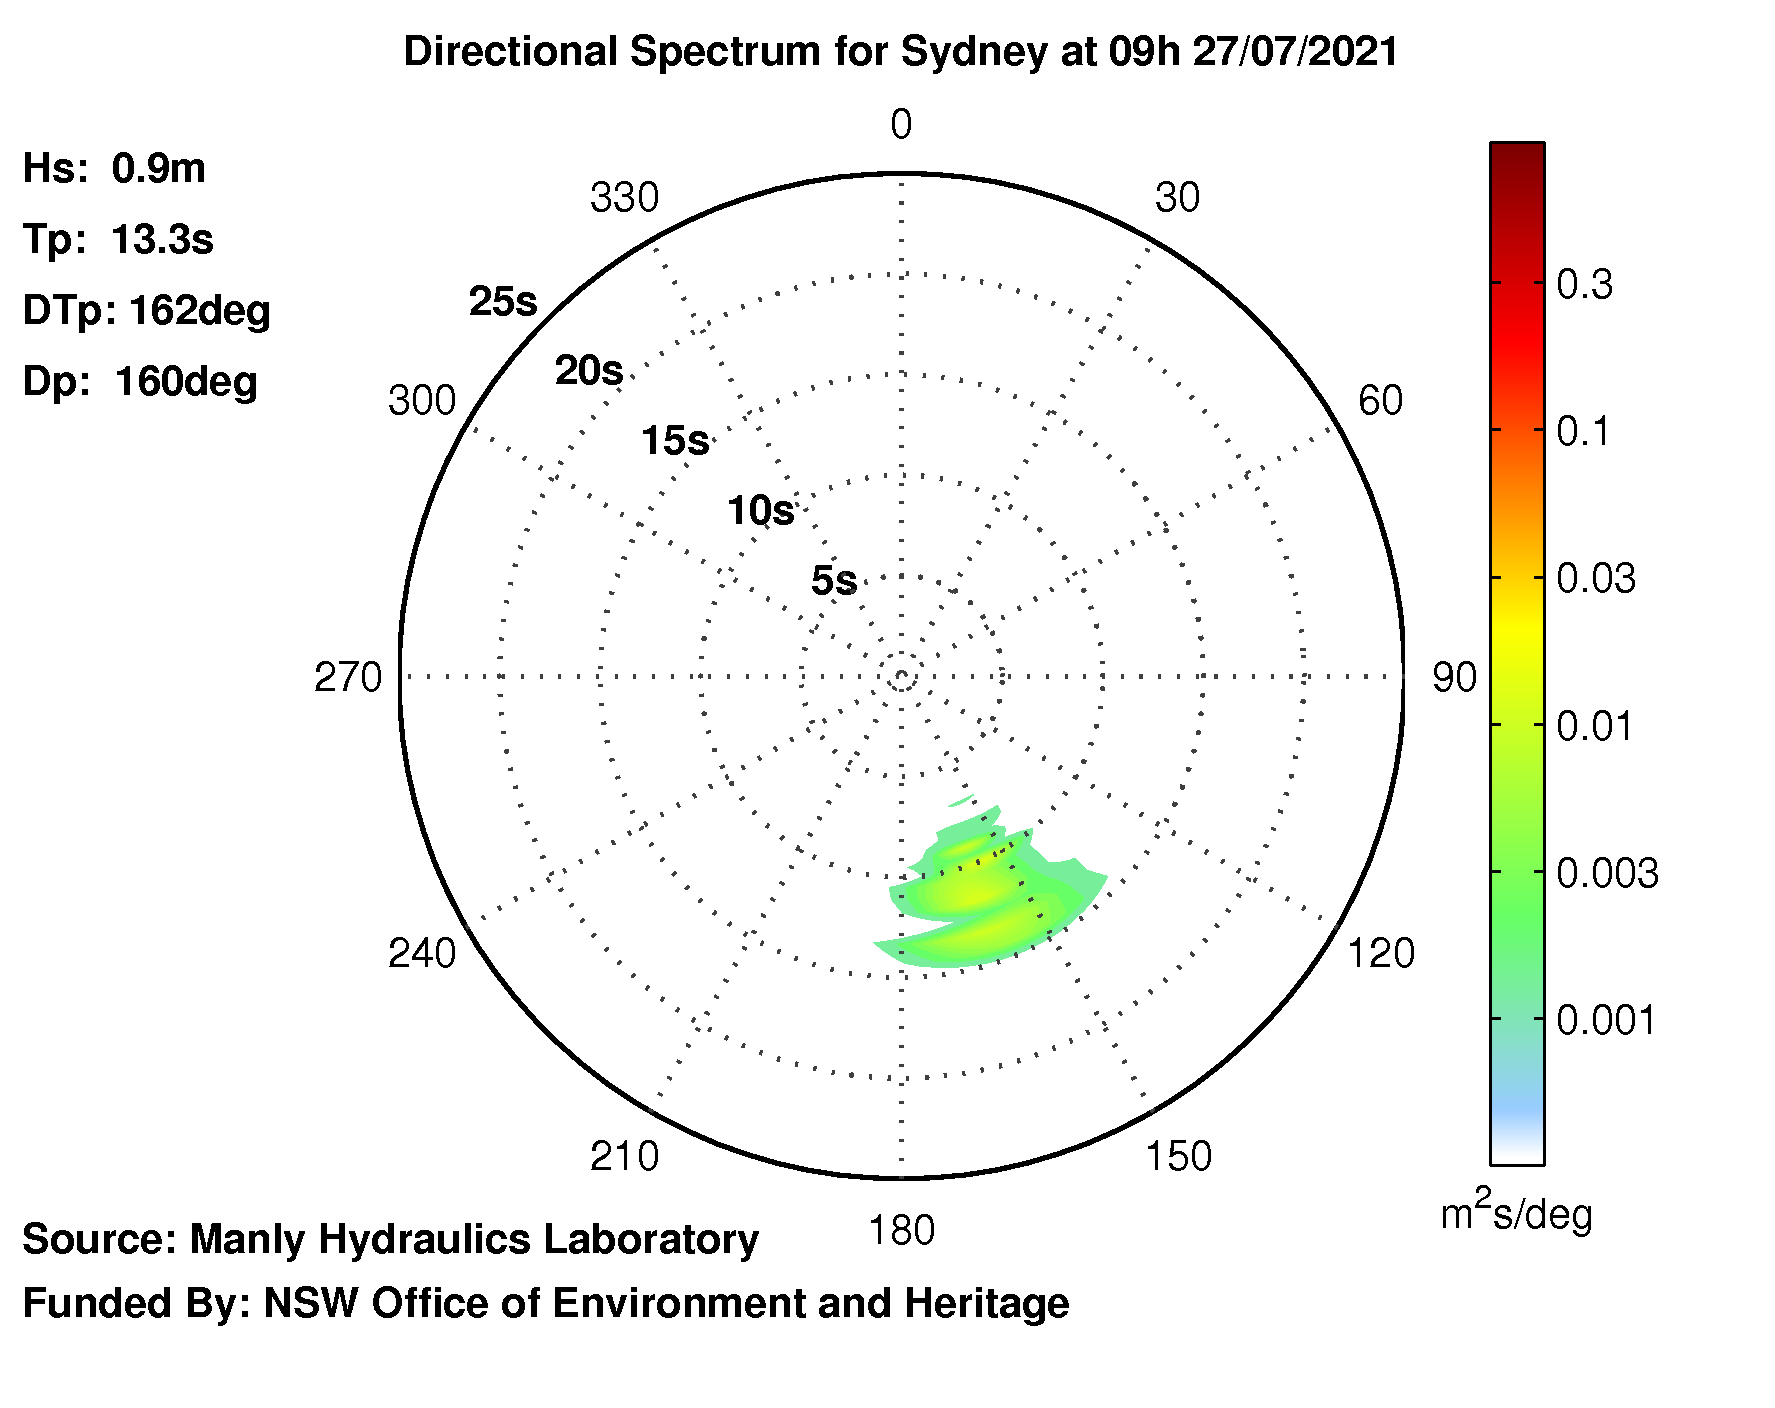
After using the information at least once a day since January 2013 I can tell you how good this graphic is.
Good!

I can now look at surf and visualise what that surf would look like as a DirSpec (directional spectrum).
More importantly I can do the opposite.
So why not extend its use to forecasting?
Let us know if you find a forecast expressed this way..


The waverider buoy is 10kms due east of Dee Why point in 100 metres of water.
ReplyDelete